Memecoin Risk Management: Essential Strategies to Protect Your Portfolio (2026)
Memecoin Risk Management: Essential Strategies to Protect Your Portfolio in 2026
Memecoin investing offers extraordinary return potential—300% gains in days, 10x returns in weeks. But with that opportunity comes equally extraordinary risk. Without proper risk management, a single bad trade or market downturn can wipe out months of gains in hours.
This comprehensive guide teaches professional risk management strategies specifically designed for Solana memecoin portfolios. You’ll learn how to protect your capital, set appropriate position sizes, use stop-losses effectively, manage correlation risk, and build a portfolio that can weather extreme volatility while capturing upside.
Key topics covered:
- Position sizing strategies that prevent catastrophic losses
- Stop-loss techniques for highly volatile assets
- Diversification and correlation analysis
- Portfolio stress testing and scenario planning
- Risk metrics every memecoin investor must track
- Mathematical approaches to risk-adjusted returns
Understanding Memecoin Risk: Why Traditional Rules Don’t Apply
Traditional investment advice says “don’t risk more than 2% of your portfolio on any single trade.” For memecoins, that rule is dangerously inadequate.
The Unique Risk Profile of Memecoins
Solana memecoins exhibit risk characteristics unlike any traditional asset class:
- Extreme volatility: Daily price swings of 50-200% are normal, not exceptional
- Liquidity risk: Tokens can become illiquid overnight if whale holders exit
- Smart contract risk: Bugs, exploits, or intentional rugpulls can zero out positions
- Regulatory uncertainty: Sudden regulatory action can crater entire sectors
- Hype dependence: Prices driven by social sentiment, not fundamentals
- High correlation: During market panic, all memecoins often crash together
The Cost of Ignoring Risk Management
Real scenario from 2024: An investor allocates $50,000 across five Solana memecoins with no risk management:
- 40% in one “sure thing” memecoin (rugpull → -100%): -$20,000
- 30% in two correlated dog tokens (market dump → -80% each): -$12,000
- 20% in a legitimate project (slow bleed → -50%): -$5,000
- 10% in a winner (+300%): +$30,000
Result: Despite one massive winner, the portfolio is down -$7,000 (-14% total return). Poor risk management destroyed the portfolio despite picking a 10x winner.
With risk management: The same investor using proper position sizing, diversification, and stop-losses would have limited losses to -$8,000 while capturing most of the +$30,000 gain, netting +$22,000 (+44% return).
According to research from Investopedia on risk measures, proper risk management is the primary factor distinguishing consistently profitable traders from those who experience account-destroying losses.
🛡️ Quantify Your Portfolio Risk
MemePortfolio.io calculates comprehensive risk metrics for your Solana memecoin portfolio including volatility, maximum drawdown, Sharpe ratio, and correlation analysis. Understand your risk exposure before it becomes a problem.
The Foundation: Position Sizing Strategy
Position sizing is your first and most important line of defense. Get this wrong, and no other risk management technique can save you.
The Maximum Loss Rule
Core principle: Never allocate more than you can afford to lose completely on any single memecoin.
Recommended position sizes for Solana memecoins:
- Conservative portfolio: Maximum 5% per position, ideally 3-4%
- Balanced portfolio: Maximum 10% per position, ideally 6-8%
- Aggressive portfolio: Maximum 15% per position, ideally 10-12%
Example: $10,000 balanced portfolio
| Token | Position Size | % of Portfolio | Max Loss if -100% |
|---|---|---|---|
| BONK | $800 | 8% | -$800 |
| WIF | $1,000 | 10% | -$1,000 |
| MYRO | $700 | 7% | -$700 |
| POPCAT | $600 | 6% | -$600 |
| MOODENG | $900 | 9% | -$900 |
| Others (5 tokens) | $6,000 | 60% | varies |
Why this matters: Even if two positions go to zero completely, you’ve only lost 17% of your portfolio, not 40%+ from over-concentration.
Risk-Adjusted Position Sizing
Advanced approach: Size positions inversely to their risk level.
Formula: Position Size = (Risk Budget) / (Token Volatility × Expected Max Drawdown)
Example calculation:
- Risk budget: 10% of portfolio can be risked per trade
- Token volatility: 80% (very high)
- Expected max drawdown: 50%
- Position size: 10% / (0.80 × 0.50) = 25% maximum position
For a lower volatility, more established memecoin:
- Token volatility: 40%
- Expected max drawdown: 30%
- Position size: 10% / (0.40 × 0.30) = 83% maximum position
Takeaway: Riskier memecoins get smaller allocations, stable ones get larger allocations—even within a memecoin-only portfolio.
Stop-Loss Strategies for High-Volatility Assets
Stop-losses in memecoins are controversial—set them too tight, you get stopped out on normal volatility. Set them too loose, they’re useless. Here’s how to do it right.
The Volatility-Adjusted Stop-Loss
Problem with fixed stops: A 20% stop-loss might work for stocks but triggers constantly on memecoins with daily 30-50% swings.
Solution: Set stop-losses based on the token’s Average True Range (ATR) or historical volatility.
Method 1: ATR-Based Stop-Loss
- Calculate 14-day ATR (average of daily high-low ranges)
- Set stop-loss at 2-3x ATR below entry price
- Example: Token has 15% daily ATR, set stop at 30-45% below entry
Method 2: Percentile-Based Stop-Loss
- Analyze token’s historical price drops
- Set stop beyond the 95th percentile of normal corrections
- Example: Token normally corrects 20-40%, set stop at 50%
Time-Based Stop-Losses
Alternative approach: Instead of price stops, use time-based exits.
Rules:
- If position hasn’t moved significantly in 7-14 days, exit
- If position is down >20% after 30 days, exit
- Prevents holding dead memes indefinitely
Mental Stop-Losses vs. Hard Stops
Hard stops (automatic orders):
- Pros: Remove emotion, guaranteed execution
- Cons: Can be triggered by wicks, may miss recovery
- Best for: Large positions, times you can’t monitor
Mental stops (manual decisions):
- Pros: Can adjust for market context, avoid stop hunts
- Cons: Require discipline, emotion can interfere
- Best for: Experienced traders, smaller positions
💡 Stop-Loss Reality Check
Scenario: You buy a memecoin at $0.10 with a 40% stop-loss at $0.06.
Market dumps: Token crashes to $0.04 (-60%) in one hour during a whale sell-off.
Stop triggered: You exit at approximately $0.06 as planned.
Next day: Token recovers to $0.09 as community buys the dip.
Result: You saved yourself from a potential -60% loss but missed the recovery. This is the trade-off with stops—they protect capital but can exit winning positions early. The key is accepting this trade-off as the cost of risk management.
Diversification: The Only Free Lunch in Investing
Diversification reduces risk without necessarily reducing returns—if done correctly.
How Many Memecoins Should You Hold?
The math: Portfolio volatility decreases as you add uncorrelated assets, but with diminishing returns after 10-15 positions.
Optimal ranges:
- Conservative: 10-15 memecoins (maximum diversification)
- Balanced: 6-10 memecoins (diversified but manageable)
- Aggressive: 3-5 memecoins (concentrated conviction)
Important: More isn’t always better. Beyond 15-20 positions, you’re adding complexity without meaningful risk reduction, and you can’t effectively monitor that many holdings.
The Correlation Trap
Critical insight: Holding 10 dog-themed memecoins isn’t diversification—they’re highly correlated and will move together.
Types of memecoin correlation:
| Correlation Type | Example | Diversification Value |
|---|---|---|
| Theme-based | All dog memes, all cat memes | Low – Move together |
| Launch timing | All launched same week | Medium – Similar lifecycle |
| Market cap | All micro-caps or all large-caps | Medium – Similar risk profile |
| Category mix | Dogs, AI, Gaming, Culture, Utility | High – Independent drivers |
Diversification strategy:
- 30% established memes (BONK, WIF) – Lower volatility anchors
- 30% different theme categories – True diversification
- 20% different market cap tiers – Varied risk/reward
- 20% different launch vintages – Lifecycle diversity
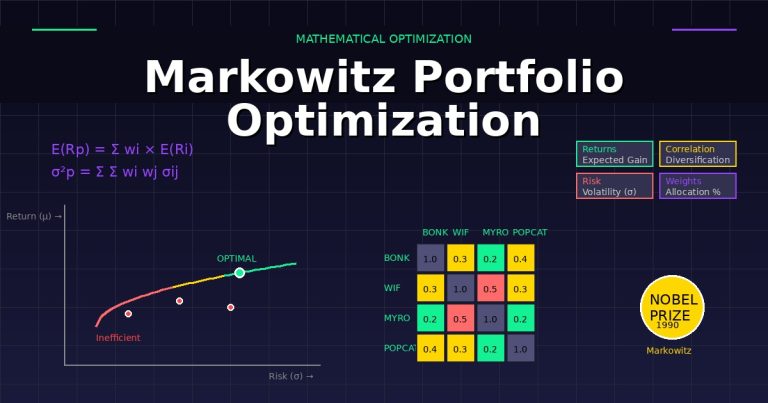
Mathematical Approach: Markowitz Optimization
The problem with manual diversification: You’re guessing at optimal allocations based on intuition.
The mathematical solution: Markowitz Modern Portfolio Theory calculates the mathematically optimal allocation across your holdings by analyzing:
- Historical returns of each token
- Volatility (standard deviation)
- Correlation between every token pair
- Your risk tolerance
Result: An allocation that maximizes expected returns for your acceptable level of risk, or minimizes risk for your target returns.
Example output: Instead of equal 10% allocations across 10 tokens, Markowitz might recommend 15% in low-volatility tokens, 8% in medium-volatility, and 5% in high-volatility—customized to your portfolio’s specific correlation structure.
📊 Optimize Your Diversification Mathematically
MemePortfolio.io uses Markowitz optimization to calculate your mathematically optimal allocation across Solana memecoins. Input your risk tolerance and instantly see the allocation that maximizes risk-adjusted returns based on correlation analysis and historical data.
Risk Metrics You Must Track
You can’t manage what you don’t measure. These metrics quantify your portfolio’s risk exposure.
1. Portfolio Volatility (Standard Deviation)
What it measures: How much your portfolio value fluctuates
Calculation: Standard deviation of daily returns over 30-90 days
Interpretation:
- Low volatility: <30% annualized (unusual for memecoins)
- Medium volatility: 30-60% annualized
- High volatility: 60-100% annualized
- Extreme volatility: >100% annualized (common in memecoins)
Why it matters: Volatility isn’t just about price swings—it’s about the probability of large losses. A portfolio with 100% volatility has a much higher chance of experiencing a 50%+ drawdown than one with 30% volatility.
2. Maximum Drawdown
What it measures: Your worst peak-to-trough loss
Example: Portfolio peaks at $20,000, drops to $12,000, then recovers. Maximum drawdown = -40%
Target ranges:
- Conservative: Accept maximum 25-30% drawdown
- Balanced: Accept maximum 40-50% drawdown
- Aggressive: Accept maximum 60-70% drawdown
Action trigger: If your max drawdown exceeds your target, reduce position sizes or increase diversification.
3. Sharpe Ratio
What it measures: Risk-adjusted returns (are you being compensated for the risk you’re taking?)
Formula: (Portfolio Return – Risk-Free Rate) / Portfolio Volatility
Interpretation:
- Sharpe < 0.5: Poor risk-adjusted returns
- Sharpe 0.5-1.0: Acceptable
- Sharpe 1.0-2.0: Good
- Sharpe > 2.0: Excellent (rare in memecoins)
Example: Portfolio A returns 50% with 80% volatility (Sharpe = 0.625). Portfolio B returns 40% with 40% volatility (Sharpe = 1.0). Portfolio B has superior risk-adjusted returns despite lower absolute returns.
4. Sortino Ratio
What it measures: Risk-adjusted returns considering only downside volatility
Why better than Sharpe: Sharpe penalizes upside volatility equally with downside. Sortino only penalizes losses, making it more relevant for asymmetric assets like memecoins where you want upside volatility.
Target: Sortino > 1.0 indicates you’re capturing upside while managing downside effectively.
5. Value at Risk (VaR)
What it measures: Maximum expected loss at a given confidence level
Example: 95% VaR of -$5,000 means: “There’s a 95% probability I won’t lose more than $5,000 in the next period.”
How to use: Sets your mental worst-case scenario. If you can’t stomach the 95% VaR loss, reduce position sizes.
6. Portfolio Beta (Against SOL or BTC)
What it measures: How your portfolio moves relative to the broader market
Interpretation:
- Beta = 1.0: Moves exactly with the market
- Beta > 1.0: More volatile than market (common for memecoins)
- Beta < 1.0: Less volatile than market (rare for memecoins)
Example: Portfolio beta of 1.5 against SOL means when SOL moves 10%, your portfolio typically moves 15%.
📈 Track All Risk Metrics Automatically
MemePortfolio.io calculates and tracks all essential risk metrics for your portfolio: volatility, max drawdown, Sharpe ratio, Sortino ratio, VaR, beta, and correlation analysis. Monitor your risk profile in real-time and receive alerts when metrics exceed your thresholds.
Scenario Analysis and Stress Testing
Hope for the best, prepare for the worst. Scenario planning helps you understand how your portfolio behaves under extreme conditions.
Common Memecoin Disaster Scenarios
Scenario 1: Market-Wide Crash
- Trigger: Bitcoin dumps 20%, Solana crashes 30%
- Impact: All memecoins typically drop 50-80% in tandem
- Test: If this happened tomorrow, what’s your portfolio value? Can you stomach that loss?
Scenario 2: Individual Rugpull
- Trigger: One of your holdings gets rugpulled (-100%)
- Impact: Depends on position size and correlation
- Test: If your largest position went to zero tomorrow, could you recover?
Scenario 3: Sustained Bear Market
- Trigger: 6-month slow bleed with no pumps
- Impact: Portfolio grinds down 60-80% through death by a thousand cuts
- Test: Do you have stop-losses that prevent this? Or rebalancing triggers?
Scenario 4: Liquidity Crisis
- Trigger: DEX liquidity dries up, can’t exit positions at fair prices
- Impact: Slippage of 20-40% on exits, effective losses much worse than chart prices
- Test: Check current liquidity on your holdings. Can you exit your full position?
How to Stress Test Your Portfolio
Step 1: Define Scenarios
Create 3-5 realistic but severe scenarios based on historical events:
- May 2022 Terra/LUNA collapse: Market-wide -70%
- FTX collapse November 2022: Everything -50% in 48 hours
- 2023 memecoin supercycle peak: +500% followed by -90% crash
Step 2: Model Portfolio Impact
For each scenario, calculate:
- Expected portfolio value after event
- Percentage drawdown from current value
- Time to recovery at various growth rates
Step 3: Identify Vulnerabilities
- Which positions hurt you most in each scenario?
- What correlations made things worse?
- Would your stop-losses have helped?
Step 4: Adjust Accordingly
- Reduce positions that create unacceptable scenario outcomes
- Add hedges or uncorrelated assets
- Tighten stop-losses on vulnerable positions
Advanced Risk Management Techniques
1. Dynamic Position Sizing Based on Market Conditions
Concept: Adjust position sizes based on overall market volatility
Rules:
- Low volatility environment: Increase positions by 20-30%
- Normal volatility: Use standard position sizing
- High volatility environment: Decrease positions by 30-50%
Measure volatility using: 30-day rolling volatility of SOL or BTC as market proxy
2. Portfolio Hedging with Stablecoins
Strategy: Keep 10-30% of portfolio in stablecoins as a volatility buffer and dry powder
Benefits:
- Reduces overall portfolio volatility
- Provides capital to buy dips without selling winners
- Psychological comfort during crashes
Trade-off: Reduces upside capture during bull runs
3. Trailing Stop-Losses
Concept: Stop-loss moves up as price increases, locking in profits
Example:
- Buy at $0.10, set 40% trailing stop
- Price rises to $0.30, stop now at $0.18 (40% below $0.30)
- Price rises to $0.50, stop now at $0.30 (40% below $0.50)
- If price drops to $0.30, you exit at $0.30, locking in 3x gains
Best for: Positions in strong uptrends where you want to capture momentum while protecting profits
4. Correlation-Based Rebalancing
Strategy: When portfolio correlation spikes (everything moving together), reduce total exposure
Example:
- Normal state: Average correlation between holdings = 0.4
- Crisis: Correlation spikes to 0.8+ (everything crashing together)
- Action: Reduce overall exposure by 20-30% until correlation normalizes
Why it works: High correlation means diversification isn’t protecting you—all positions are effectively one bet
5. Kelly Criterion for Optimal Bet Sizing
Formula: f = (bp – q) / b
Where:
- f = fraction of portfolio to risk
- b = odds received (potential gain / potential loss)
- p = probability of winning
- q = probability of losing (1 – p)
Example:
- Potential gain: 100% (2x)
- Potential loss: 50%
- Probability of success: 60%
- Kelly fraction: ((2 × 0.6) – 0.4) / 2 = 0.4 or 40% of portfolio
Important: Kelly tends to be aggressive. Use half-Kelly (20% in this example) for more conservative sizing.
Psychological Risk Management
Technical risk management means nothing if emotions override your system.
Common Emotional Traps
1. Loss Aversion Paralysis
- Problem: Refusing to take small losses, hoping for recovery
- Result: Small losses become large losses
- Solution: Treat stop-losses as portfolio protection, not admission of failure
2. FOMO Over-Allocation
- Problem: Seeing a memecoin pump, going all-in at the top
- Result: Massive position at worst possible price
- Solution: Stick to position size rules regardless of FOMO intensity
3. Revenge Trading
- Problem: After a loss, immediately doubling down to “get even”
- Result: Compounding losses through emotional decisions
- Solution: Mandatory 24-hour break after significant loss
4. House Money Effect
- Problem: After big gains, treating profits as “house money” and taking excessive risk
- Result: Giving back all profits through carelessness
- Solution: Treat profits as YOUR money, apply same risk rules
Building Risk Management Discipline
Pre-trade checklist:
- Have I calculated position size based on my rules? (Yes/No)
- Do I know my exact exit points before entering? (Yes/No)
- Can I afford this position to go to zero? (Yes/No)
- Am I making this decision rationally or emotionally? (Rational/Emotional)
- Does this fit my portfolio’s overall risk profile? (Yes/No)
If any answer is wrong, don’t take the trade.
Risk Management for Different Market Conditions
Bull Market Risk Management
Unique risks:
- Overconfidence leading to oversized positions
- Ignoring warning signs because “everything goes up”
- Chasing performance and buying tops
Adjustments:
- Use trailing stops to protect profits
- Take partial profits regularly (20-30% on 2x gains)
- Maintain position size discipline despite easy gains
- Watch for distribution signs (volume declining on rallies)
Bear Market Risk Management
Unique risks:
- Death by a thousand cuts (slow bleed)
- False bottoms and dead cat bounces
- Liquidity drying up
Adjustments:
- Reduce overall exposure by 30-50%
- Tighten stop-losses (can’t wait for recovery)
- Increase stablecoin allocation
- Focus on preserving capital, not catching falling knives
Sideways Market Risk Management
Unique risks:
- Death by boredom (making trades just to do something)
- Whipsaw losses from choppy action
- Missed opportunities waiting for clarity
Adjustments:
- Reduce position sizes (lower conviction environment)
- Use time-based stops (if no movement in 14 days, exit)
- Focus on risk management, accept lower returns
Building Your Risk Management System
Week 1: Assessment
- Calculate current portfolio risk metrics (volatility, max drawdown, Sharpe ratio)
- Document all current positions and sizes
- Identify any over-concentrated positions (>15% of portfolio)
- Calculate correlation between holdings
Week 2: Rules Creation
- Set maximum position size rules
- Define stop-loss methodology (ATR-based, mental, or time-based)
- Establish rebalancing triggers based on risk metrics
- Create your pre-trade checklist
- Define your acceptable maximum drawdown
Week 3: Implementation
- Adjust current portfolio to align with new rules
- Set stop-losses on all positions
- Remove over-concentrated positions
- Add diversification where correlation is too high
Week 4+: Ongoing Management
- Weekly: Review risk metrics, check for rule violations
- Monthly: Full portfolio risk assessment, stress testing
- Quarterly: Review and refine risk management rules based on results
🛡️ Implement Professional Risk Management Today
MemePortfolio.io provides all the tools you need to implement institutional-grade risk management for your Solana memecoin portfolio. Automated risk tracking, position sizing calculators, correlation analysis, and Markowitz optimization—all in one platform.
Free risk analysis • Connect wallet in 30 seconds • Start managing risk immediately
Conclusion: Risk Management Is Your Competitive Advantage
In memecoin investing, everyone has access to the same tokens on the same DEXs. Your edge isn’t what you buy—it’s how you manage risk.
The reality: Most memecoin investors will experience at least one -50% or worse drawdown in their first year. The difference between those who survive and those who don’t is risk management.
Key principles to remember:
- Position sizing is your first defense – Never risk more than you can afford to lose completely
- Diversification only works if assets aren’t correlated – Holding 10 dog memes isn’t diversification
- Use stop-losses adapted for volatility – Fixed percentage stops don’t work on memecoins
- Track risk metrics, not just returns – A 100% return with 200% volatility is worse than 60% with 80% volatility
- Mathematical optimization beats intuition – Markowitz allocation consistently outperforms equal weighting
- Discipline beats strategy – The best risk management system is worthless if you don’t follow it
According to Risk.net’s analysis of portfolio risk management, systematic risk management approaches reduce portfolio volatility by 20-40% while maintaining similar returns—essentially a free improvement in risk-adjusted performance.
Your memecoin portfolio will experience volatility—that’s unavoidable. But with proper risk management, you control the downside while capturing the upside. That asymmetry is how you build lasting wealth in memecoins rather than experiencing boom-bust cycles that leave you no better off than when you started.
Action plan:
- This week: Calculate your current risk metrics and identify vulnerabilities
- This month: Implement position sizing rules and set stop-losses
- Ongoing: Track metrics weekly, stress test monthly, refine quarterly
The memecoins in your portfolio will change. Market conditions will shift. But your risk management system should remain constant—evolving based on data, not emotion.
About MemePortfolio.io
MemePortfolio.io is the leading portfolio optimization and risk management platform for Solana memecoin investors. Using advanced Markowitz optimization algorithms, comprehensive risk analytics, and real-time correlation analysis, the platform helps investors build and maintain portfolios that maximize risk-adjusted returns. Connect your Solana wallet to automatically import holdings and receive instant risk assessment, optimization recommendations, and ongoing portfolio monitoring. Github, Medium, Twitter.
Disclaimer: This article is for informational and educational purposes only and does not constitute financial advice. Memecoin investments are highly speculative and volatile. Risk management strategies cannot eliminate risk entirely or guarantee profits. Only invest what you can afford to lose completely. Past performance does not indicate future results. Always do your own research and consider consulting with a qualified financial advisor before making investment decisions.